Collections
Last Updated: 2026-06-15
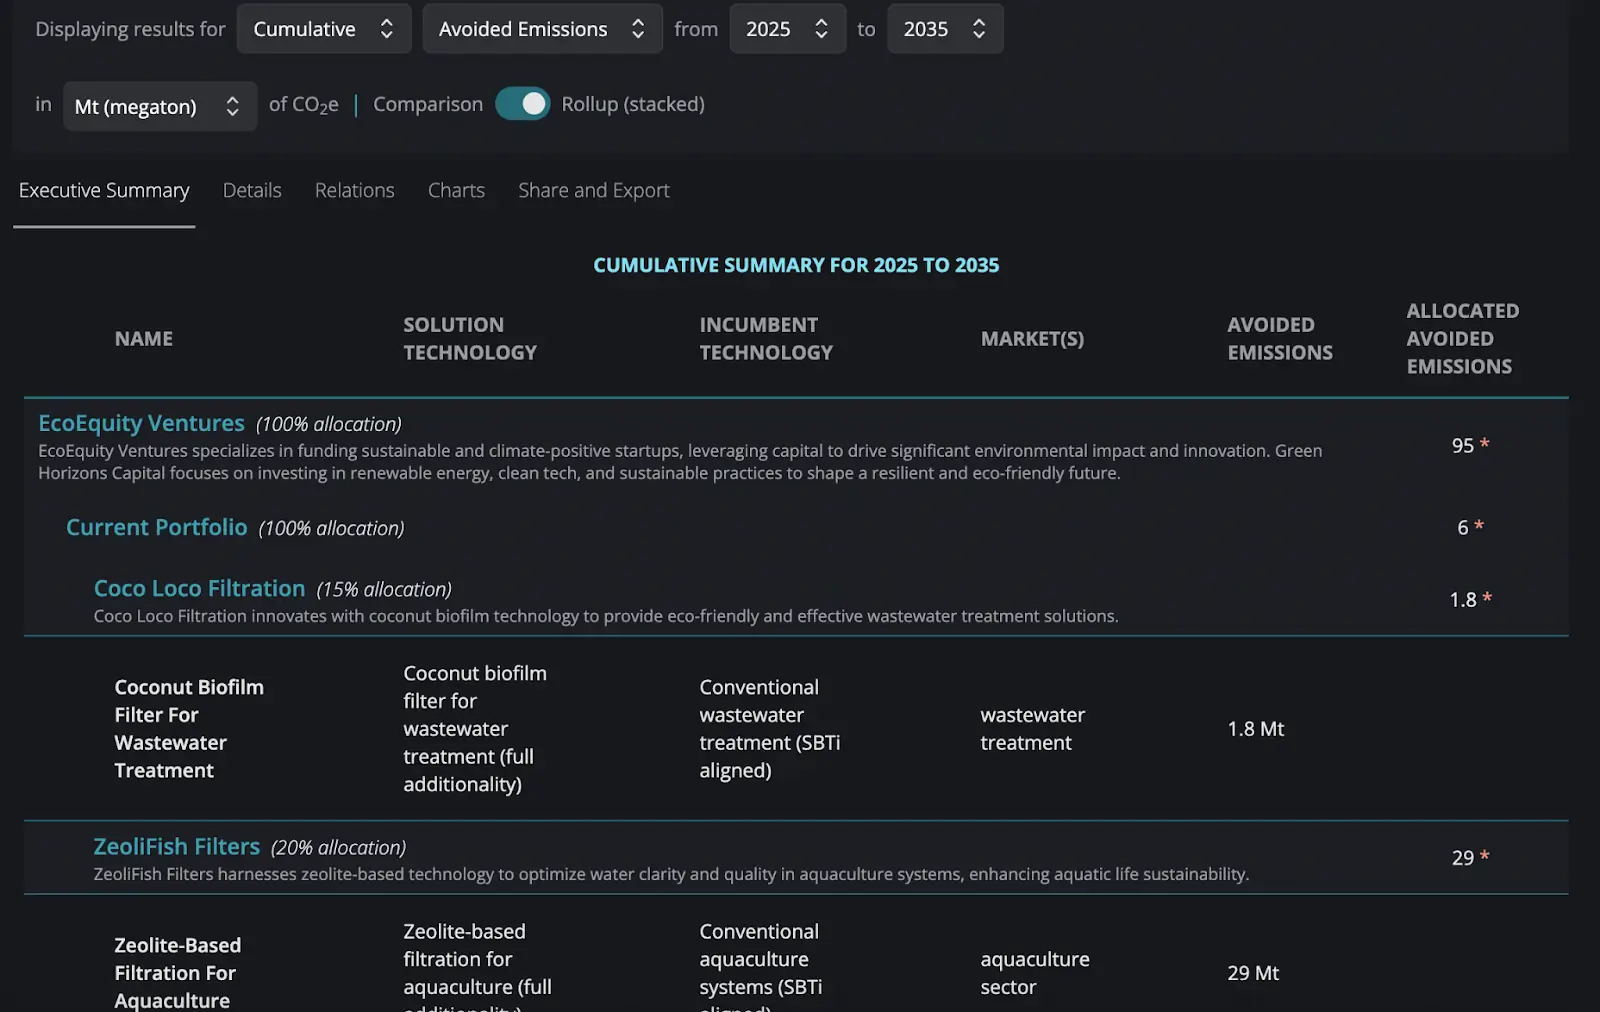
Example collection showing auto unit conversion and rollup across a small portfolio.
Summary
Collections are a versatile feature in Koi designed to organize, group, and compare various analyses, datasets, or sub-collections. Whether you're:
- assessing a single company with different impact scenarios,
- managing a portfolio of companies,
- or even coordinating multiple portfolios,
collections enables aggregate data views and analysis. Manage analysis complexity with built-in comparisons of outcomes from different scenarios or markets and gain a clear perspective on potential impacts.
Watch this overview to learn how Collections work in Koi
Why Is It Important?
In the ever-evolving world of investment and innovation, staying ahead means understanding the ripple effects of each technological intervention. Collections offer a structured playground to compare and contrast various scenarios and representations of your innovations or investments. Supercharge your decision-making with both aggregated and detailed comparisons available within Collections.
How Do I Use It?
- Create a Collection: Navigate to "Collections" and
Create New Collection.- Collections can represent anything from a single company to complex market comparisons to a portfolio of companies (and beyond).
- Add Data: Navigate to a technology model and select
Add to Collection.- You can incorporate various elements such as technology models, baseline scenarios, solution scenarios, market sizes, and market captures.
- It's also possible to add incomplete analyses and update them later.
- Compare or View Aggregate Results: Delve into the aggregated data or explore specific comparisons to tailor insights to your strategic needs.
Pro Tips
- Nested Collections: Utilize the ability to nest Collections within one another to create a multi-layered data hierarchy. This enables portfolio or technology class segmentation, as we have seen requested by some Koi users. For uniformity, we recommend creating a shell collection for each analysis so you can add your own description and allocation factor.
- Allocation Factors: Assign an allocation factor (from 0% to 100%) to each sub-collection within a Collection. This allows you to specify the influence each sub-collection has on the overall avoided emissions calculations of the parent collection.
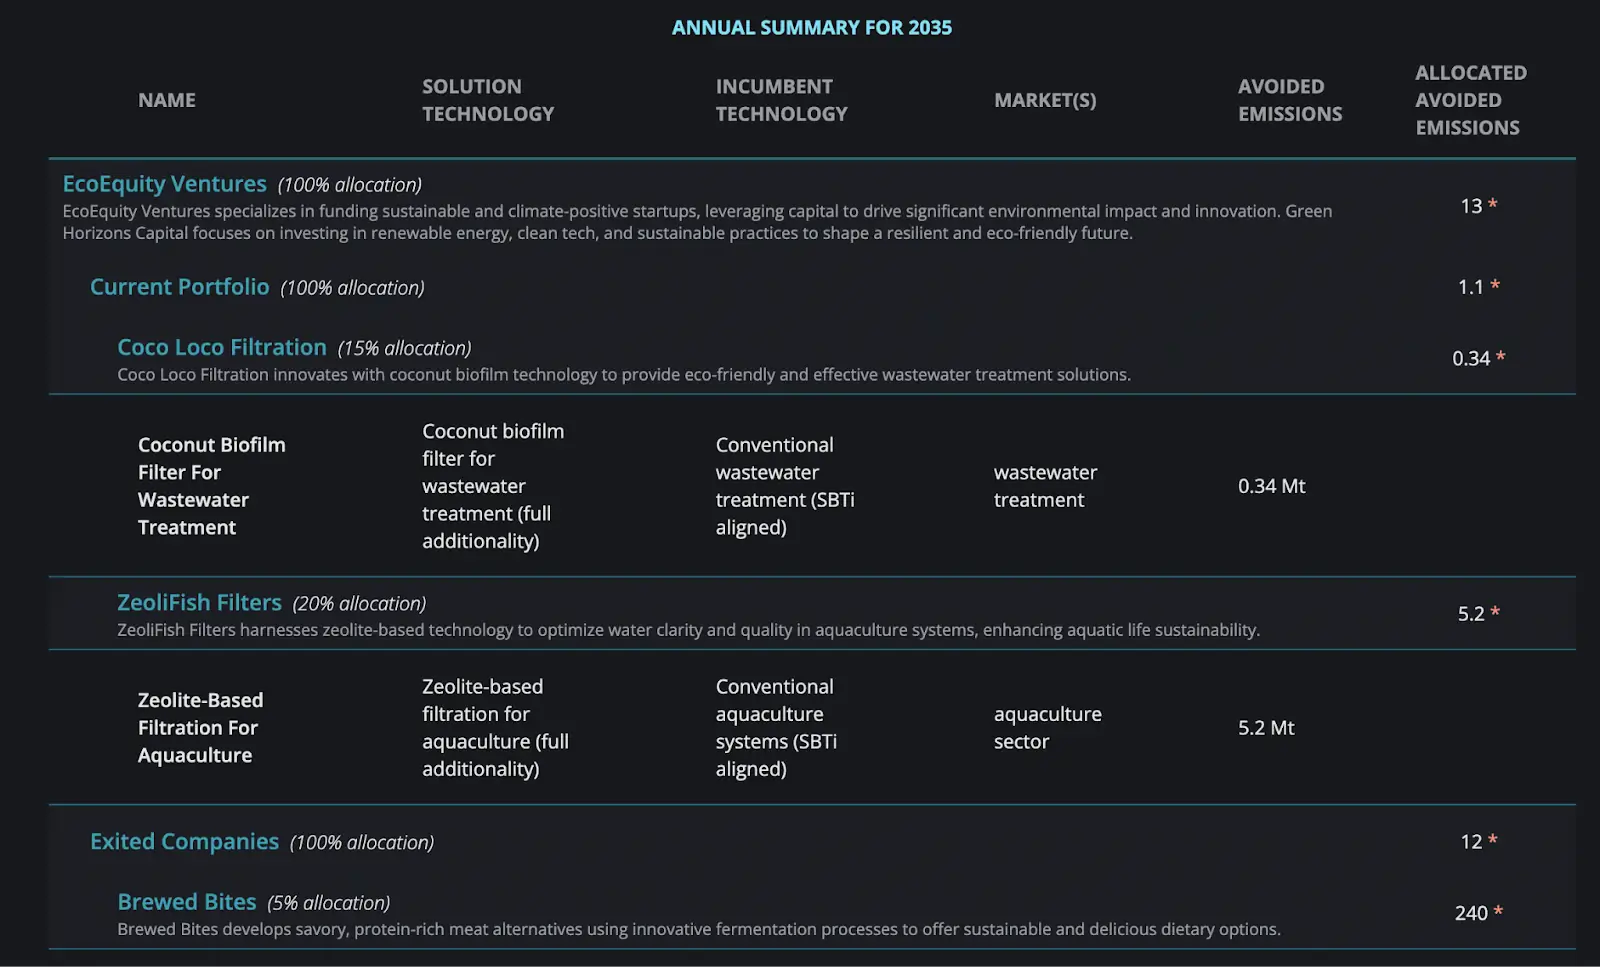
- Automated Unit Conversion: Combine and view your results in any unit you want with automated unit conversions. "Mixed" units are the default units for each individual analysis. In order to view a rollup of your results, you'll need to select a unit that is not "mixed".
Frequently Asked Questions
- Are there any limits to the number of Collections I can create?
- There are currently no limits to the number of Collections or components you can create, allowing you to scale your analysis as needed.
- Can I view the aggregate impact of a Collection?
- Yes, you can view the aggregate impact of a Collection by using the
Rolluptoggle located in the collection settings toolbar. - NOTE: Exercise caution, as this process can lead to potential double-counting of avoided emissions across different technologies. It's important to remember that the summed values within a Collection may not accurately represent the total impact.
- Yes, you can view the aggregate impact of a Collection by using the
- Can I share Collections with my team members or other organizations?
- Yes! In any collection, navigate to
Share and Exportfor sharing. - Read our docs on Sharing for more information.
- Yes! In any collection, navigate to
Use Case: Investor Porfolio
Create a Collection to Represent Your Current Portfolio of Direct Investments
Objective: Manage and analyze a portfolio of investments in companies that are geared towards developing sustainable solutions.
Example collection showing investments in a portfolio.
Step-by-Step Guide:
- Create a Top-Level Collection:
- Navigate to your
Collectionsthrough the main navigation. Create New Collectionand provide a descriptive name.Collections allow you to organize your data however you want. However, we recommend agreeing to a convention to keep it consistent across your team. For example, the top level Collection may be Acme Ventures Fund 1.
- Navigate to your
- Add Company Forecasts to the Collection:
- For each company in your portfolio, find a representative technology model in Koi by searching either by the company domain or technology name.
- Of course, you can create your own custom models.
- From the
Forecastpage of each representative technology, click onAdd to Collection.- Koi allows you to create Collections as you go. In this example, we will create a new Collection for each Forecast that represents each Company.
- In the Add to Collection dialog,
Select or Add Collection, type the name of your company, e.g.Portco A, then press+ Add collection: Portco Ato create it.- If you have already created a Collection you want to use, select it from the list.
- For each company in your portfolio, find a representative technology model in Koi by searching either by the company domain or technology name.
- Organize and Structure the Collection:
- Back in the main
Collectionsview, add each Company collection to your Acme Ventures Fund 1 Collection.- Optional: Within the Collection, organize companies by categories such as technology type, market impact, or investment size. For instance, separate companies into renewable energy, waste management, and sustainable agriculture.
- Specify the
allocation percentageif you want to denote how much of your resources are invested in each company on the details tab of your parent collection.
- Back in the main
- Analyze Portfolio Performance:
- Use Collections to compare the performance and impact of different companies or technologies.
- Analyze avoided emissions, market reach, and technological impact to assess which investments are performing according to your sustainability goals.
- Adjust:
- Add new companies or technologies to the collection as your investment strategy evolves over time.
Use Case: Sensitivity Analysis
Compare Different Baseline Scenarios in a Model for a Sensitivity Analysis
Objective: Compare potential outcomes from displacing different incumbent technologies and evaluate the sensitivity of impact. This analysis will help to understand how variations in baseline assumptions (e.g., GHG intensities, market sizes) influence the projected impacts of proposed technologies.
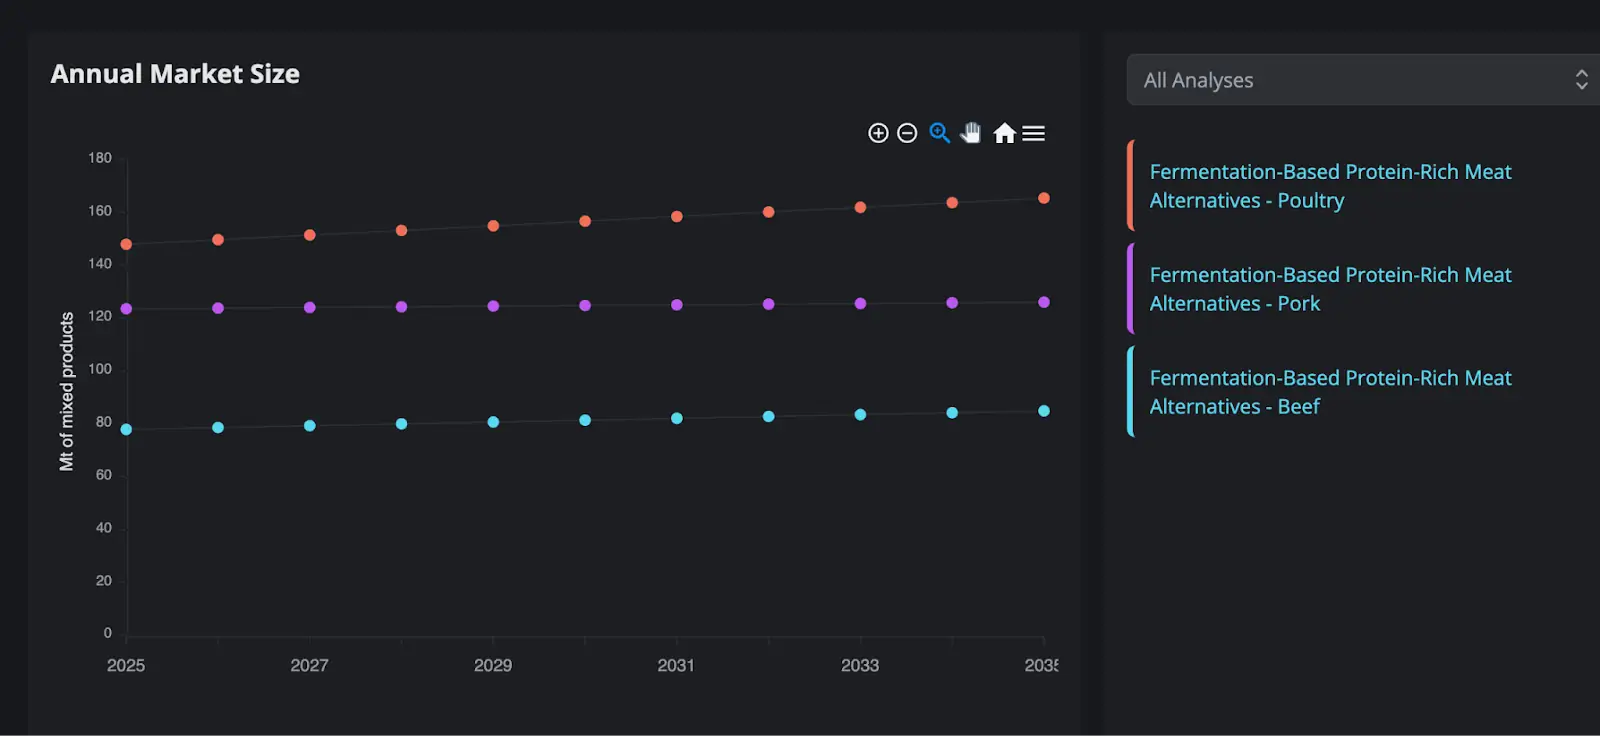
Example Market Size comparison across fermentation-based proteins.
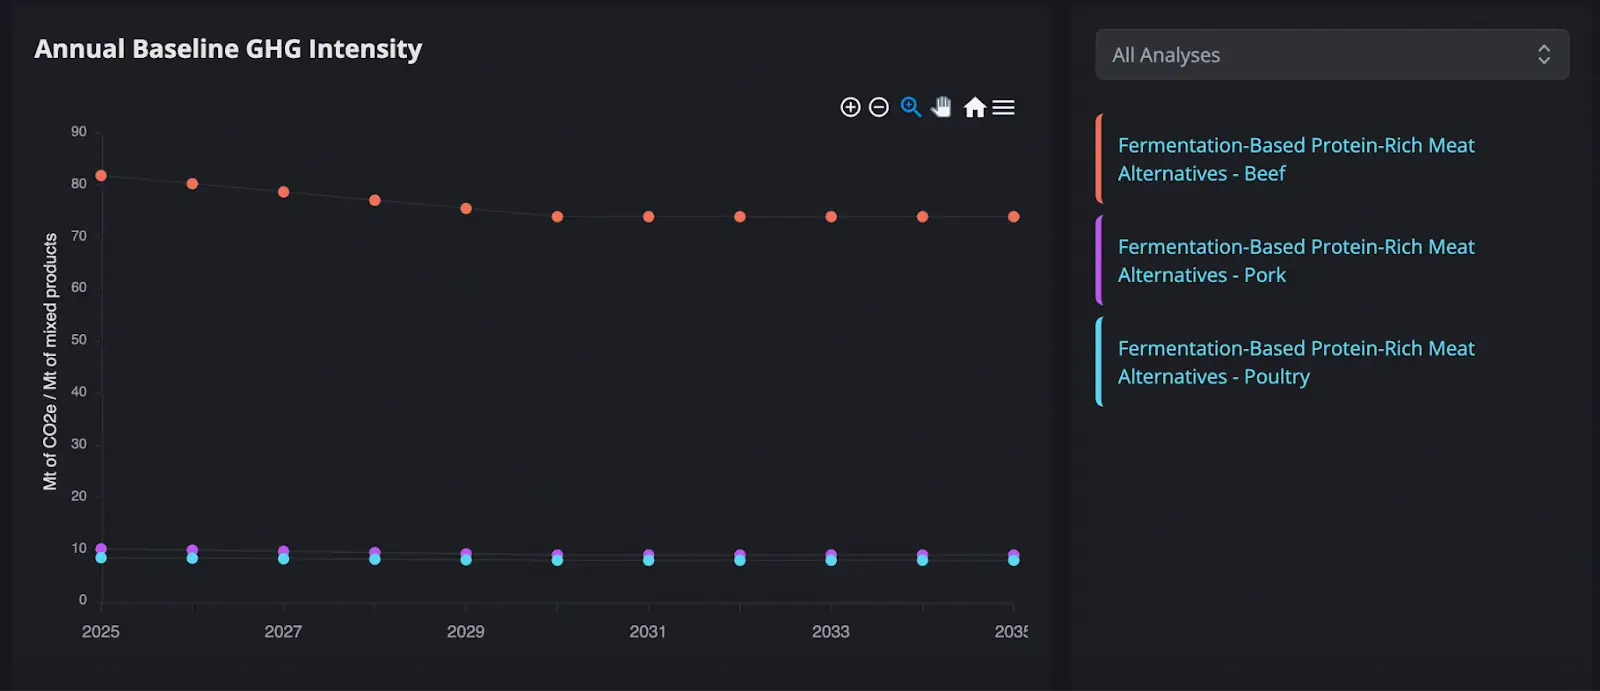
Example Baseline GHG Intensity comparison across fermentation-based proteins.
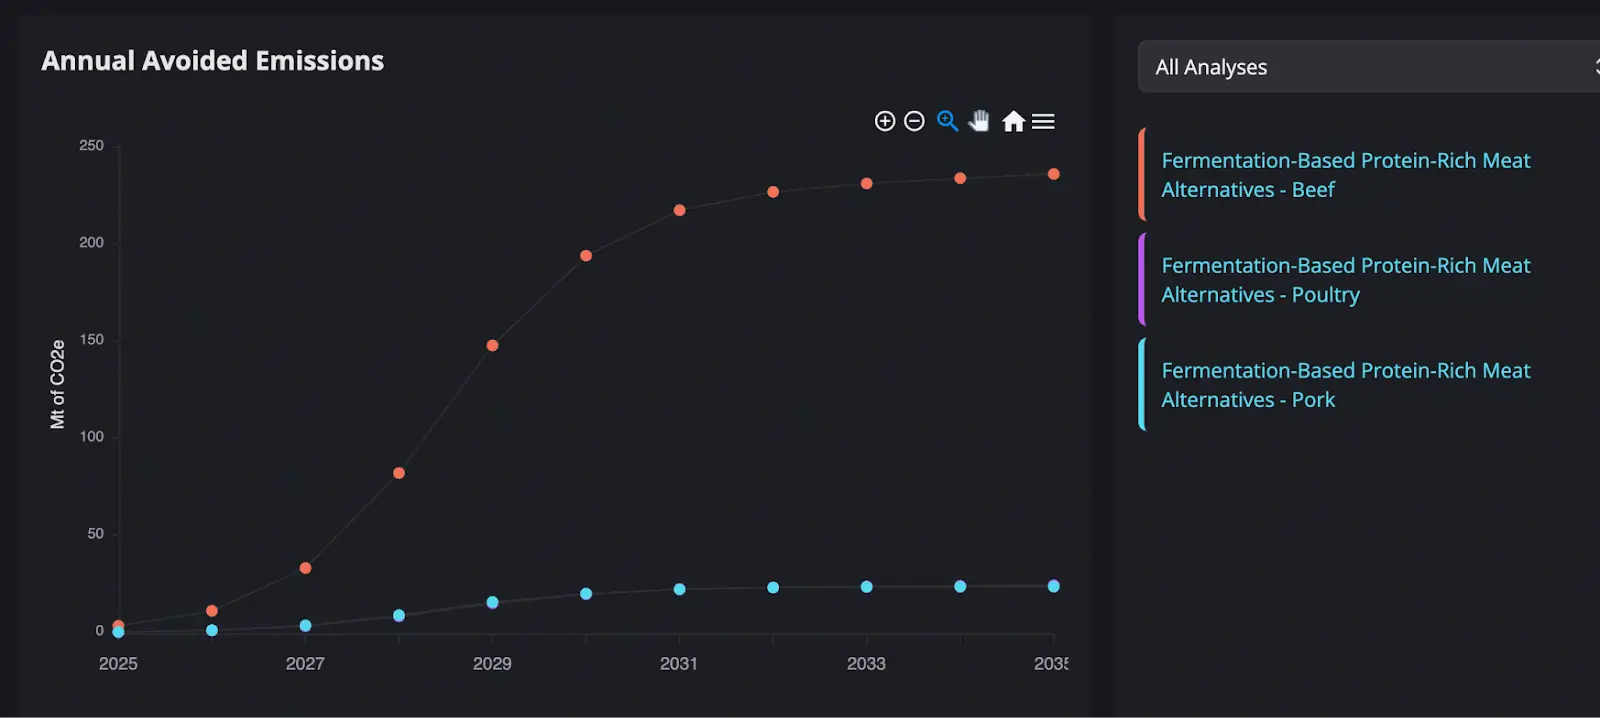
Example Avoided Emissions comparison across fermentation-based proteins.
Step-by-Step Guide:
- Initiate a New Collection:
- Navigate to your
Collectionsthrough the main navigation. Create New Collectionand name the collection to reflect your current investment portfolio, for instance, Scenario Comparison.
- Navigate to your
- Select a Technology or Initiative:
- Choose the technology or initiative for which you want to perform the sensitivity analysis. This selection should be based on strategic importance or where outcomes are most uncertain. In this example, we’ll compare Fermentation-Based Protein-Rich Meat Alternatives replacing chicken, beef, or poultry meat.
- Set Up Baseline Scenarios:
- Navigate to a technology model.
- Select (or create) different baseline scenarios and markets to reflect a range of possible conditions you want to explore. For instance:
- Scenarios replacing chicken meat, beef meat, and poultry meat. Or,
- A conservative scenario with lower market growth, an optimistic scenario with higher market adoption, and a best-guess scenario.
- Once you have a scenario to include in the comparison (by selecting from baseline and market options), click
Add to Collectionand add it to your created Collection.
- Compare Results:
- Navigate to your Collection to view results.
- You can use the
Executive Summarytab for a snapshot of the results or theChartstab to visualize the time varying results.You can change the type of results to view avoided emissions, baseline scenario impact, solution scenario impact, or market projections depending on what you want to investigate.