Koi Engine:
AI-Accelerated Impact Modeling
Last Updated: 2026-06-15
Overview
Koi builds avoided emissions models on demand. Starting from a solution description or company website, the Koi Engine produces a customized, auditable forecast designed to equip innovators and investors with analytics that accommodate different use cases, timelines, and technologies. Models are built on a pre-validated Data Lake that integrates extensively curated, foundational data from reliable sources such as the IEA, SBTi, and the US Federal LCA Commons. These inputs feed Koi's LCA Library, which segments them into climate-solution-ready value chains.
Koi's 9,000+ climate solution models progress in quality from Rapid → Refined → Diligence, aligning speed and depth with different use cases. Koi contains primarily Rapid models, with each model's Datasheet displaying QA tags stating the level of manual scientist review and data verification. Refined and Diligence models have been developed for a suite of common climate solutions with manual research and using the latest academic literature, SEC filings, and decarbonization pathways. These models can be found within the search by filtering results according to QA level.
New model when no suitable Koi match is found. Built automatically with the Koi Engine using trusted data and automatically bounded for plausibility.
Model enhanced with client input and deeper review by Rho scientists; includes third‑party verification.
Fully customized model tailored to firm‑specific diligence criteria; comprehensive QA and third‑party verification.
Models can easily be upgraded in quality in-app using Edit Mode to manually verify and/or modify inputs. Alternatively, our team can build a model for your specific use case through Koi's Services—see pricing and tiers at koi.eco/pricing.
Key Concept: The world is complex! We believe pre-computing every combination of technology, intervention type, conventional system, potential baseline, geography, market, etc. is a fool's errand. Koi takes a different approach, which focuses on iteration and ease of use:
- Rapidly model a well-structured starting point using a consistent methodology.
- Validate and refine models if and when appropriate (e.g. when moving through diligence).
- Produce auditable, versioned models that can continue to be refined as companies scale.
Using trustworthy baseline emissions and market data as a foundation, Koi's computational engine instantly constructs a climate solution technology model that includes anticipated life cycle intervention points and potential market uptake.
Climate Solution
Overview
Provide solution name & description
Data Lake
Integration
Align to relevant datasets from the Koi Data Lake
Solution
Modeling
Model solution based on curated data foundation
Rapid, On-Demand Forecasts
AI-Accelerated Modeling
The Koi Engine constructs a model in four stages, starting from a brief solution description (or company website) and progressing to a fully customizable forecast:
- Identifies the relevant baseline and solution value chains for comparison
- Matches those value chains to aligned GHG intensity and market data in the Koi Data Lake
- Fills solution‑specific data gaps and replaces irrelevant data with solution‑specific inputs (e.g., modifications to solution performance and future market uptake)
- Produces a fully customizable starting model with transparent data inputs, references, boundaries, and assumptions
These stages ensure a clear handoff from discovery to alignment to tailoring, resulting in a transparent, auditable starting point that can be refined as necessary.
Part 1: Data Lake Matching
The Engine starts by mapping a climate solution description to representative baseline and related solution value chains, then aligns each with comparable GHG intensity and market data from the Data Lake.
Building models with the Data Lake ensures accurate underlying data, evergreen models that can be automatically updated when underlying data are updated, and consistency across technologies and markets.
The Koi Engine works modularly, allowing Rho Impact scientists or Koi users to select their desired underlying data to construct the model with if they want to curate the matching process.
Example Data Lake Matching (Automated or Manual)
Climate Solution
Matched Baseline
The matching process also ensures unit compatibility and conversion between GHG intensity and market data—a critical aspect of our innovative impact data structuring and processing methods. For the mathematical foundations to work correctly, the units must align so that intensity × market size produces meaningful avoided emissions. This removes the conventional friction analysts face with assembling models from data in misaligned units. For example, baseline data may be expressed in emissions per mass output, solution performance is reported by the company per energetic input, and the market is measured by its value. These incompatibilities are handled by having an extensive data lake to pull from for complete models with aligned units.
Example Unit Compatibility for an Energy Model
Baseline GHG Intensity
Baseline Market Size
Baseline Emissions
AI-assisted matching accelerates model creation, but transparency remains paramount. Data sources and assumptions are fully referenced, and users can review and refine the results as needed.
Part 2: Solution-Specific Data Filling
After matching, the Engine models the solution's performance relative to established value chains. Using existing GHG lifecycle data as a template, the solution's performance is grounded in reliable input data with clear assumptions around lifecycle intervention points and efficiencies.
Example Value Chain Intervention Points
Any missing data is filled using AI to summarize related literature. For example, if the Data Lake doesn't have an appropriate market size in compatible units, a new one will be automatically generated with public reports and AI. All AI-generated data are clearly reported on the Datasheet page of each model.
Modeling the market capture (i.e., share of baseline activity that the solution can reasonably address) remains an area with wide variation in approach amongst practitioners and stakeholders:
- For early-stage screening, impact is often estimated by the solution's maximum plausible market capture (company agnostic).
- Investors later in the deal process typically use company-specific market-capture estimates that reflect diligence findings.
- Innovators typically prioritize uptake modeled on near-term deployment forecasts.
Example Market Capture Scenarios
Because the choice of how to model market diffusion is use case and solution specific, there was a need for a scalable approach that combines the most common criteria and leaves room for easy user modification.
The Engine offers the first automated method of estimating future solution deployment, while Koi's Edit Mode enables quick addition or editing of modeled market uptake. Each solution has its market capture automatically estimated using a novel process that identifies competitors in SEC filings and uses their sales data to approximate a successful future maximum market capture and deployment timeline for the solution being modeled. While this approach offers the first automated way of estimating future solution impact that does not make a blanket assumption around market uptake (e.g., just assuming 100% plausible displacement by 2050), it is an area of planned improvement due to recognized limitations.
Current limitations to Koi's automated market capture modeling:
-
S-curve approximation: S-curve diffusion is used by default, but S-curves are most appropriate for technology diffusion, not single-company diffusion. Using company data to inform an S-curve is therefore a rough approximation.
-
Private company exclusion: Companies not on public exchanges don't file with the SEC and therefore aren't considered within the pool of competitor data.
-
Novel technology gaps: Technologies not well represented by current competitor activities—either because of technology novelty or the suite of technologies offered by a company—may not be related to competitor earnings.
While an area for improvement, the automated market capture modeling provides a cogent starting point for rapid assessment of a solution's future impact. As with all components of the automated models, the data should be manually reviewed and refined to accommodate the intended use case.
Manual Verification and Model Customization
While the Koi Engine provides a structured, auditable starting point for impact modeling, manual verification and review remain essential for ensuring model accuracy and relevance to specific use cases. Assuring models requires human oversight to validate automated model assumptions, verify the logic of the utilized data, and tailor parameters to specific contexts.
Self-Service Model Customization
Koi license holders can customize and verify models directly in the platform using Edit Mode. This feature allows users to:
- Review and modify model inputs, assumptions, and parameters
- Verify data sources and references
- Adjust market capture scenarios and deployment timelines
- Incorporate company-specific data and insights
- Validate baseline comparisons and solution performance metrics
Edit Mode is accessed from a public model by first cloning the model (Model Actions → Clones & Customize), then opening Edit Mode (Model Actions → Edit Mode). Once in Edit Mode, users can create tailored versions of existing models with full control over all inputs, documentation, and sharing permissions.
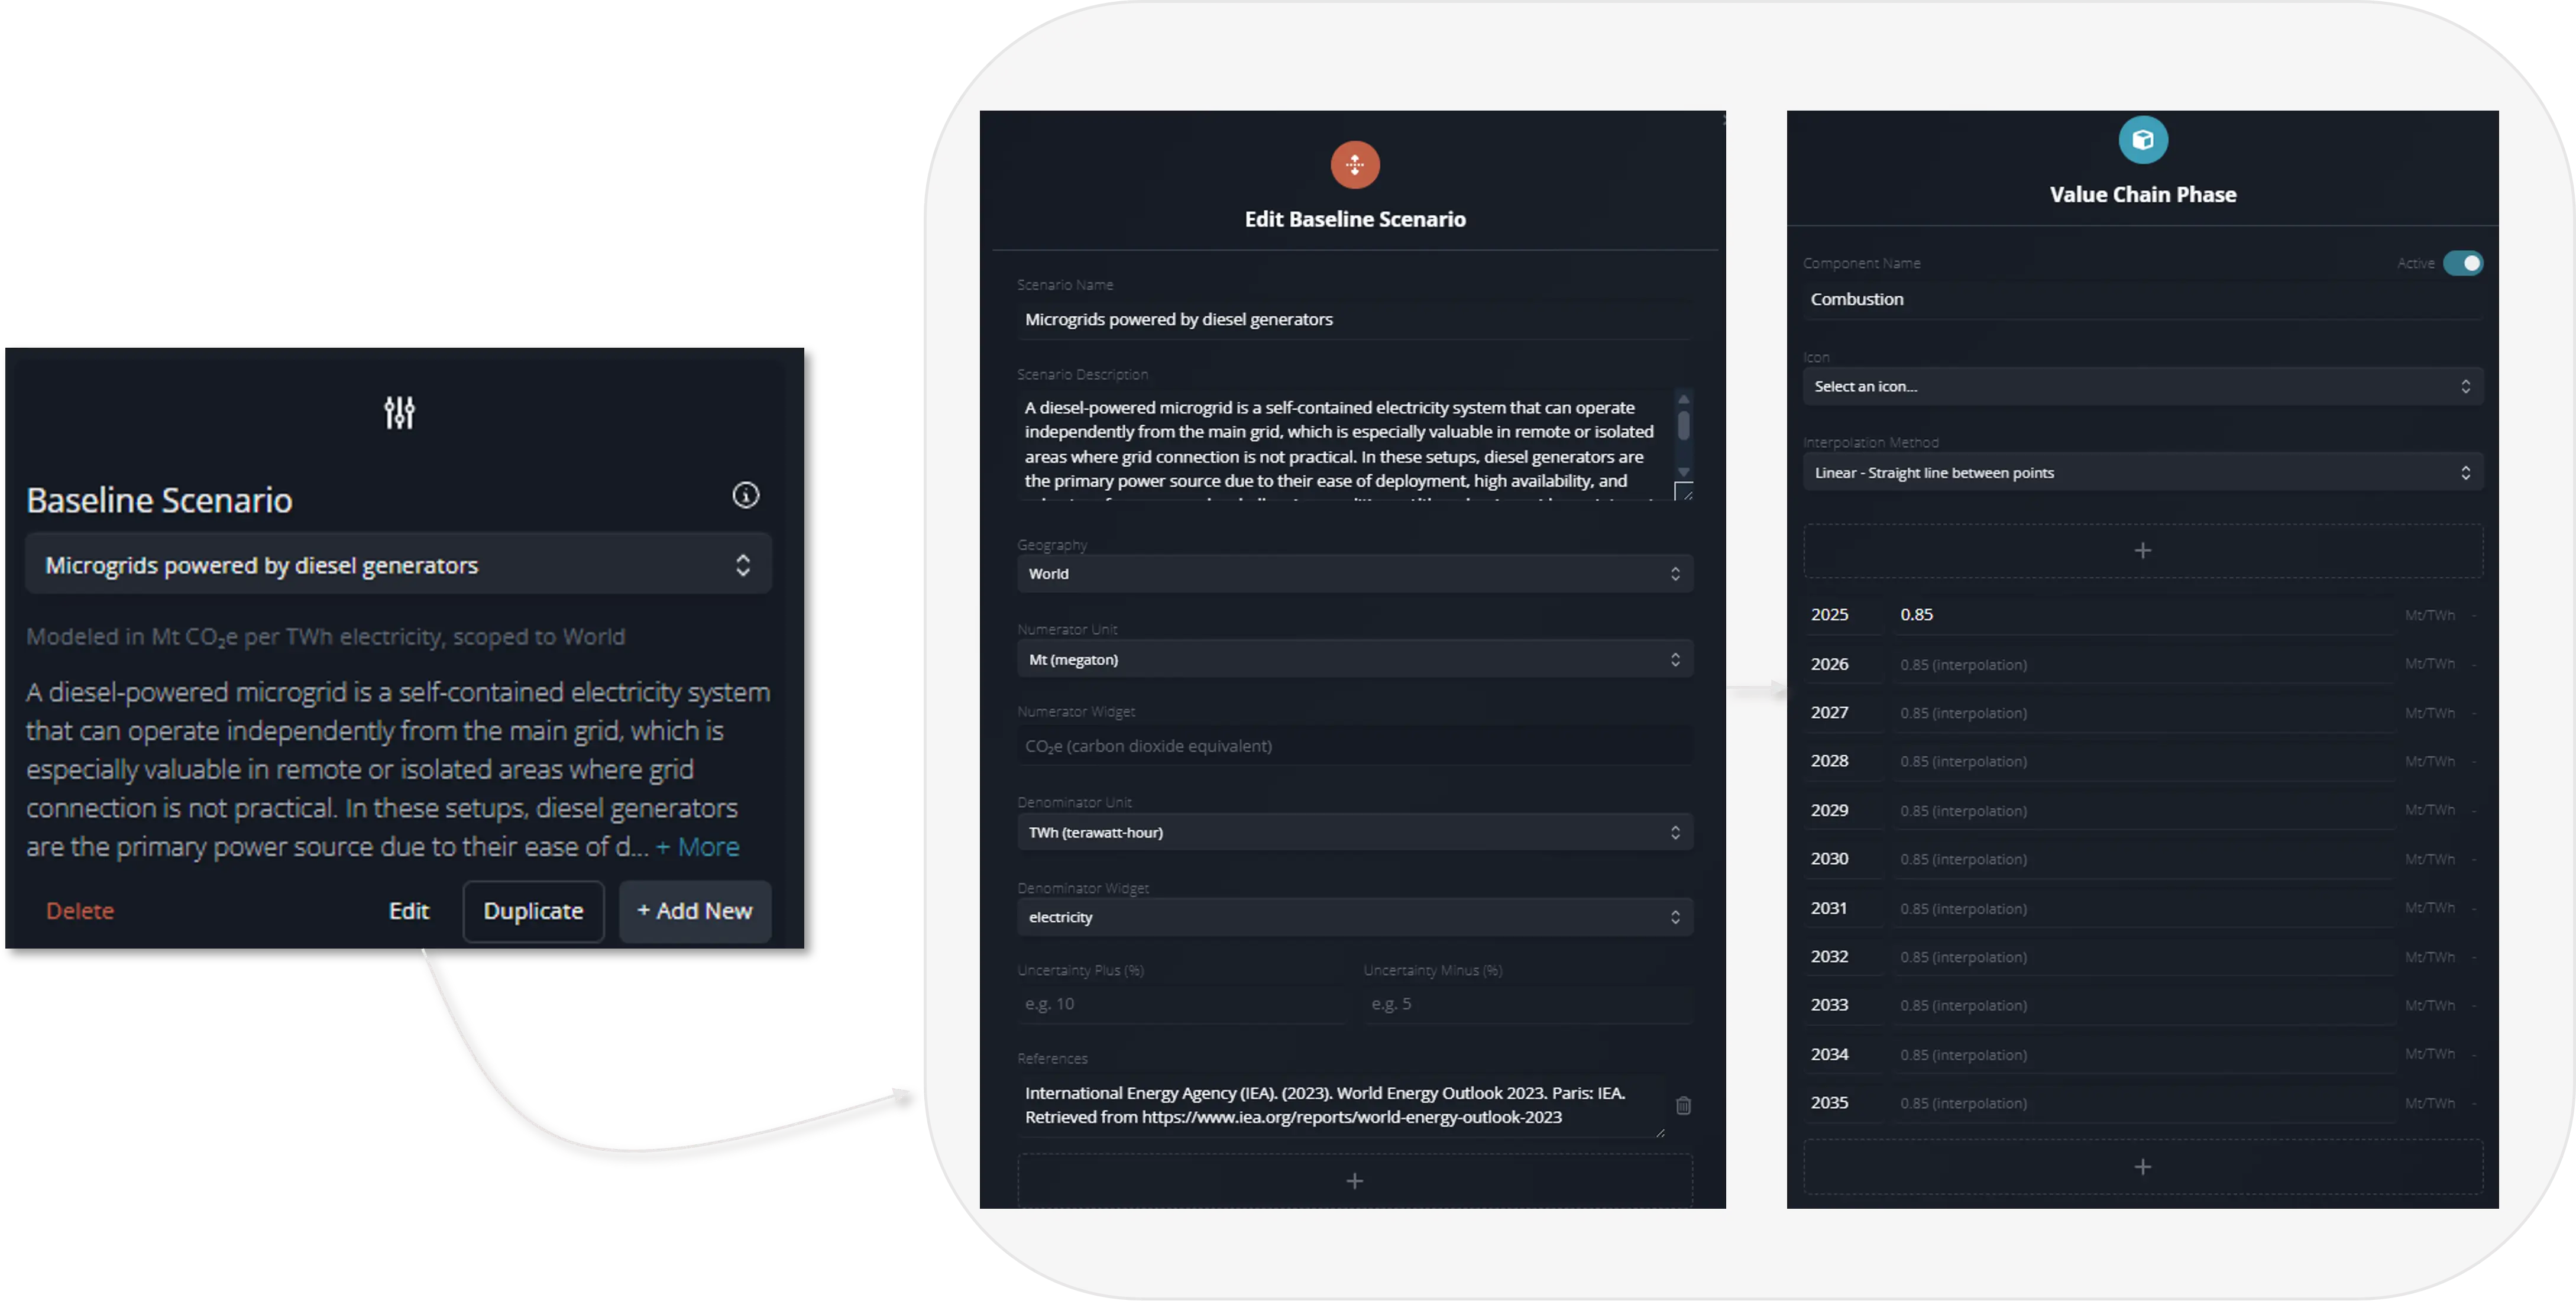
In Edit Mode, all model inputs can be customized. This figure shows example views for editing the baseline GHG intensity data.
Versioning Every Koi model is versioned. Navigate to the Datasheet page to see the Version being viewed. Prior and future versions of a model can be selected from the dropdown. Customized models allow users to decide when to create new major and minor versions when saving. This is critical for
auditing and is particularly helpful for quarterly and annual reporting as realized impact is compared to the
initial potential impact modeled.
Commissioned Forecasting Services
For users who prefer expert assistance or require comprehensive model development, Forecasting Services are offered in multiple tiers. New models typically begin with auto-generating a draft based upon relevant data from the Koi Data Lake, then undergo quality assurance by trained scientists via manual review, research and refinement.
Our fastest quality assurance option, Rapid Models, use the engine to autogenerate a model draft and then have a scientist perform essential quality assurance (see services page for specific assurances). We also offer services for higher-tier models with additional manual refinements that add significant nuance.
In cases where a solution model does not yet exist, or the user has customization or quality assurance requests they prefer not to implement themselves, commissioning a new model may be of interest.
Use Case Considerations
Each use case requires specific considerations of technology nuance and detail.
Some Koi users model the potential impact of early-stage ventures, where significant uncertainty surrounds both the future product and target market. These users often find that rapid models are well-suited to their needs given the inherent uncertainty, the wide range of technologies under consideration, and budget constraints.
Conversely, other users require a deep understanding of potential investment impacts and prefer our higher-tier models, which integrate our scientists' technical expertise through stakeholder engagement and discovery, while still leveraging the efficiencies of automated modeling.
Starting with the auto-generated model, our scientists focus on the details that matter—whether it's regional specificity, incorporating insights from white papers or technical reports, or modeling unique lifecycle phases for the solution.
This approach produces well-structured models in a fraction of the time manual analysis requires. Further, anchoring models to the foundational Data Lake not only saves precious time but also ensures consistency and data intercompatibility across analyses both now and in the future as the underlying data are updated.