Quickstart
Last Updated: 2026-06-15
Introduction
Get started with Koi's climate solution database and impact forecasting tools. This quickstart guide will walk you through exploring Koi's climate solution data, building forecasts, and organizing them into collections—whether for product types, markets, investment portfolios, or even portfolios of portfolios. Let's dive in.
- Set Up a Collection: Koi Collections act as folders for organizing and grouping different analyses. Use the toolbar to navigate to Collections > Create New Collection with a name and description. Collections may represent any grouping of interest to the Koi user, such as technology type, market application, or investment portfolio. For more information on creating a Collection, view our Collection documentation.
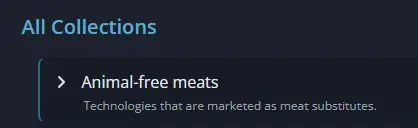
Example collection created to explore animal-free meats.
- Explore Koi's Data: Navigate to the Search section and explore Koi's datasets. Try searching keywords and even URLs of company websites. Notice the tags under each climate solution name that indicate the availability of associated data. For more information on searching for climate solutions and other data, view our Search documentation.
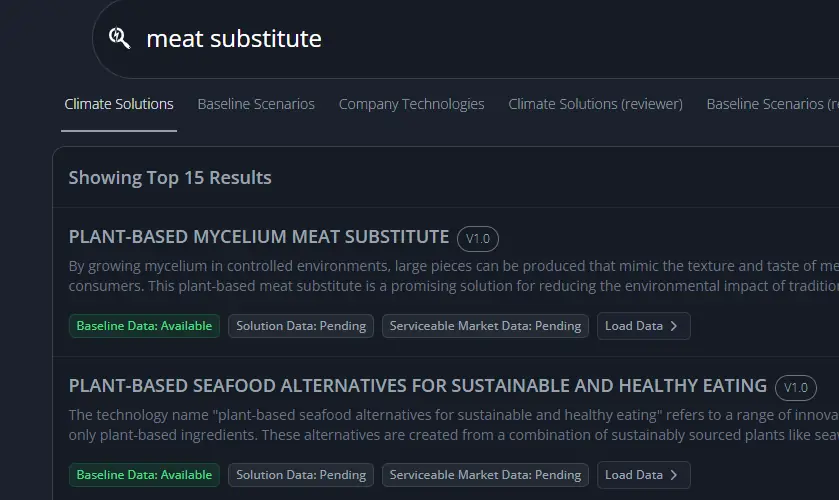
Example search results for climate solutions that have associated baseline GHG intensity data.
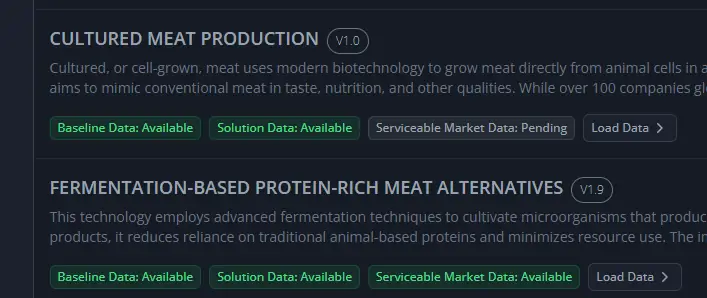
Example search results that have additional data available including solution GHG intensity and market size.
-
Save Climate Solutions: Begin loading and visualizing climate solution pages.
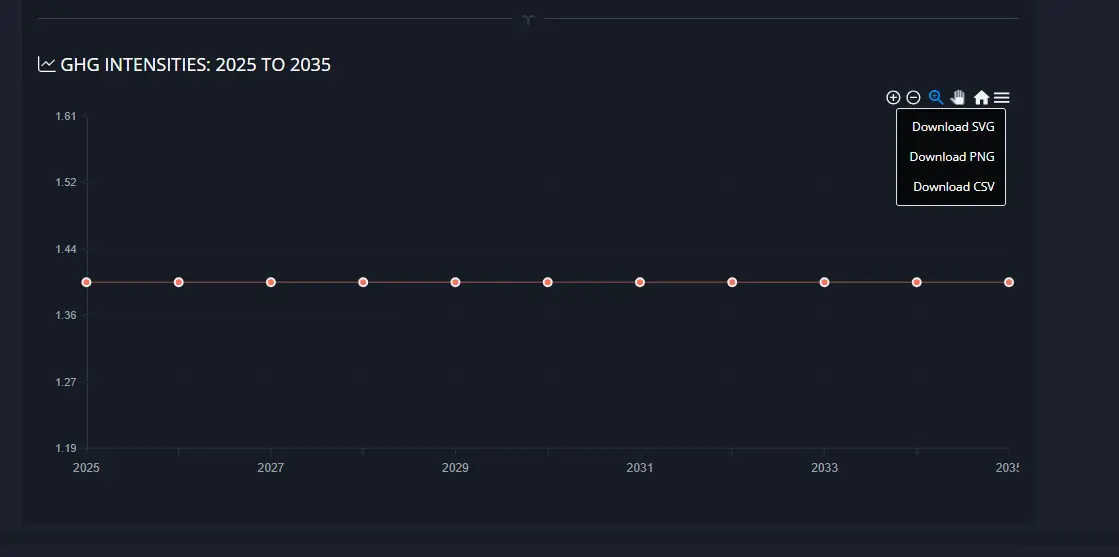
You can export data individually from charts or in bulk from the datasheet tab.
When you identify a climate solution you want to return to later, use the right hand buttons to save it either as a Bookmark or as an item within your Collection. You may adjust parameters such as the timespan and functional unit before saving, and your selections will be retained when accessed later.
We recommend adding a climate solution to a Collection when the data have been reviewed by the user and are fairly complete for their use case.
Bookmarks are intended for datasets of interest but those that need further user review or alterations. For example, for data gap supplementation, refinement, or integration into a different model.
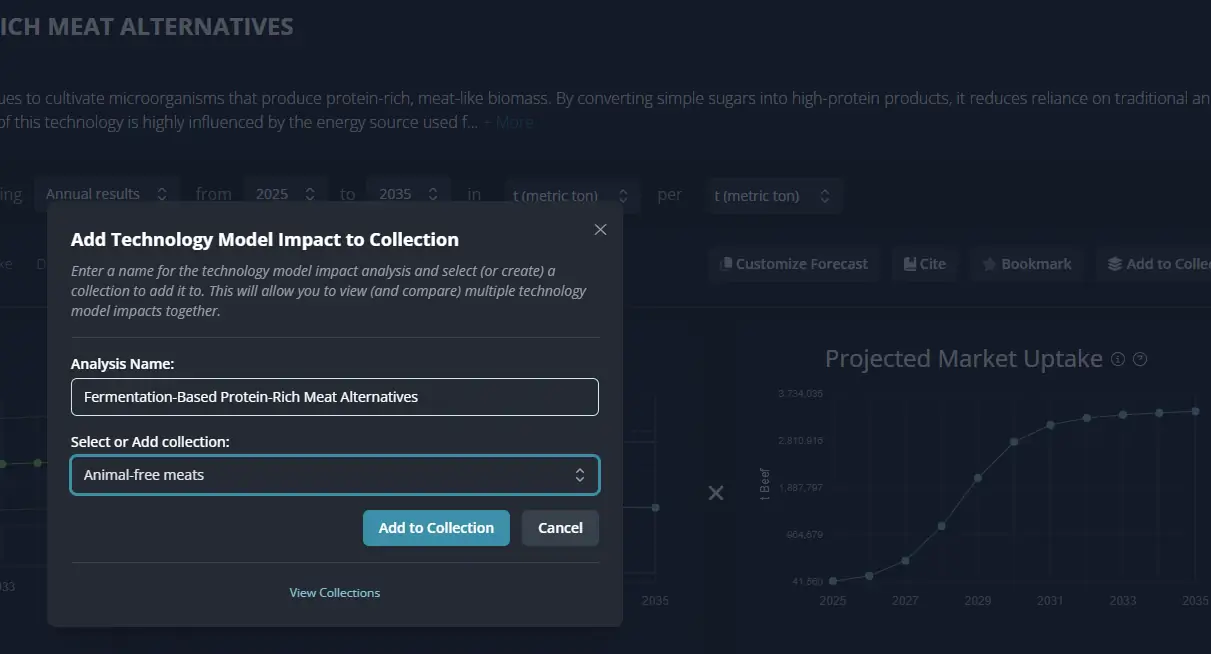
Climate solution being added to a collection via the *Add to Collection* button (upper right corner).
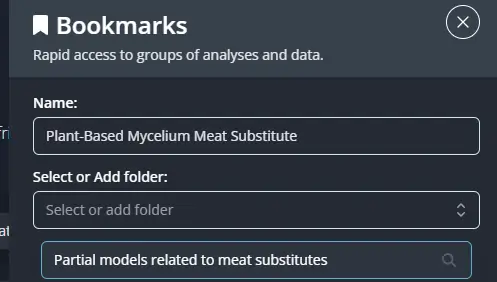
Climate solution being saved as a bookmark within a new folder via the *Bookmark* button (upper right corner)
- View Solution Summaries: Koi’s new Solution Summary Page gives you a high-level snapshot of a climate solution’s planned or potential impact—no math required. It auto-calculates impact using incumbent market data and visualizes the result, making it easy to explore the details and clearly communicate how the impact was derived.
Learn how to use the Executive Summary tab in Collections
Understanding a solution’s full impact goes beyond just its Avoided Emissions Factor. This update automates key calculations and presents them visually, saving time and making it easier to share insights with stakeholders.
To get started, navigate to any solution within Koi using the search bar, this will open the Solution Summary Page by default, providing an instant snapshot of the potential or planned impact. You can interact with the visual equation or data by clicking on different elements to explore various scenarios.
- Explore your collection: Access a summary of your collection models and view the aggregated data by navigating through the various collection tabs, starting with the Executive Summary. Climate solutions within a collection can be added, removed or modified.
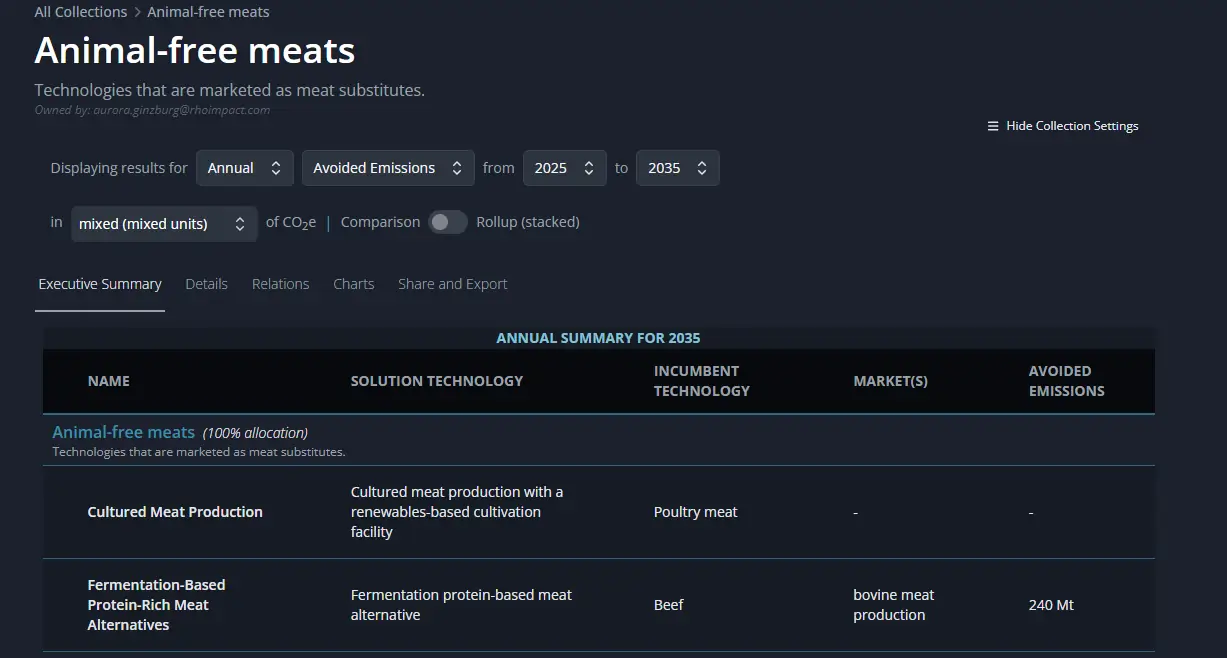
Executive summary view of a collection.
-
Modify models and refine your collection: With Koi, the pond is yours to navigate—whether you're taking a casual swim with the pre-built models or diving deep to refine every detail.
Customize climate solutions to develop complete models that appropriately represent your system. The level of effort you invest will determine how tailored your results are to your specific needs. Some find that the complete pre-built models are enough for their purposes, while others choose to put in more work to fine-tune and customize their models.
Use Koi's editing capabilities to make minor or major changes, mix and match Koi datasets, supplement with your own literature findings, and adjust market sizes to reflect the desired type of analysis.
Below are some example workflows for model refinement using Koi data.
Note that all custom models are automatically created as clones of the original Koi model and are saved to a user's private Forecasts. A cloned model will need to be re-added to a collection, and the Koi original removed.
-
Share your collection: Collaboration is key in climate impact forecasting, and Koi makes it easy to share your work. You can share your Collections with teammates, investors, or stakeholders—granting them controlled access to view or edit your analyses. Use the
Sharebutton in theShared & Exporttab to invite collaborators by email or group, selecting their permission level (Viewer, Editor, or Manager). For more information on sharing, view our Sharing documentation.
Workflow Example 1
Include additional GHG intensities for comparison in a climate solution model.
Download CSV baseline data from one climate solution.
Use the Customize Forecast feature to clone and edit an existing climate solution model. The custom model will inherit all of the existing model data and the user will supplement with the additional data scraped from the above CSV.
Add the new solution GHG intensity from the CSV data in the previous step.
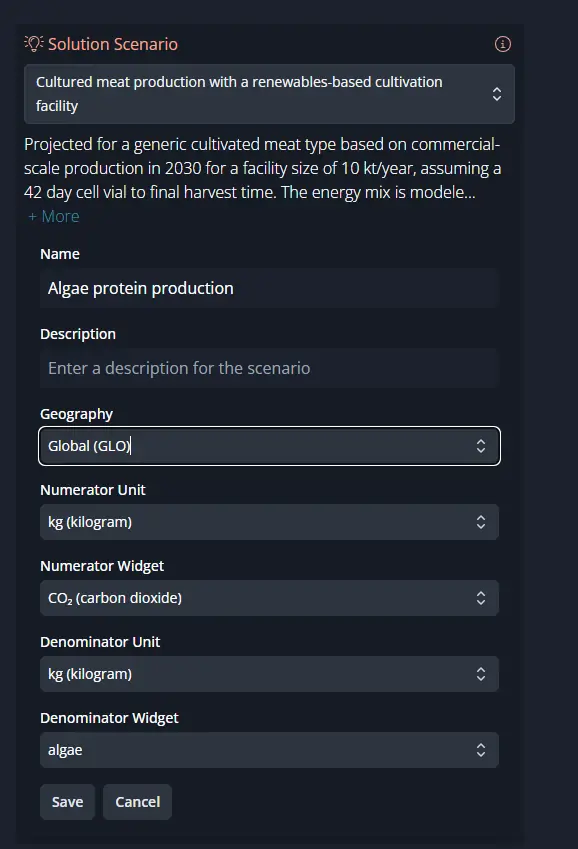
Create a new **Solution Scenario** for the GHG intensity studied in the separate dataset.
Workflow Example 2
How to fill in a data gap to enable collection-level viewing of model results.
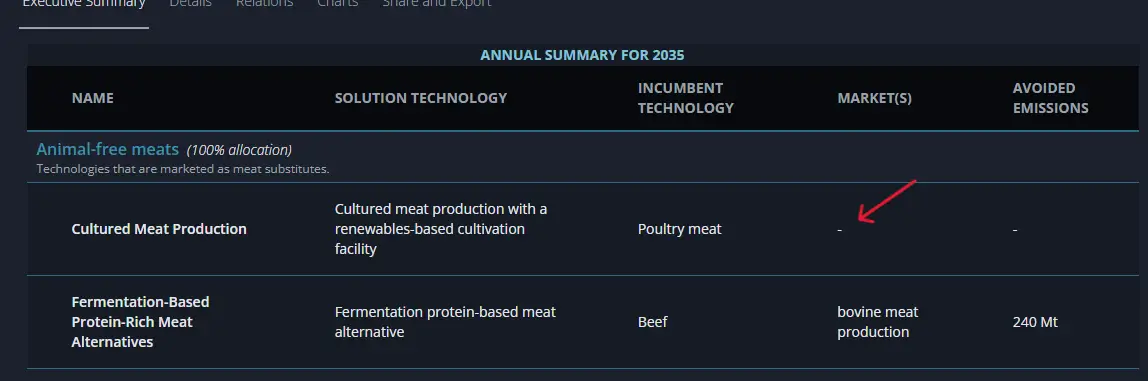
Collection shows that one of the climate solutions (here it is Cultured Meat Production) can't compute the total avoided emissions because the market data are missing.
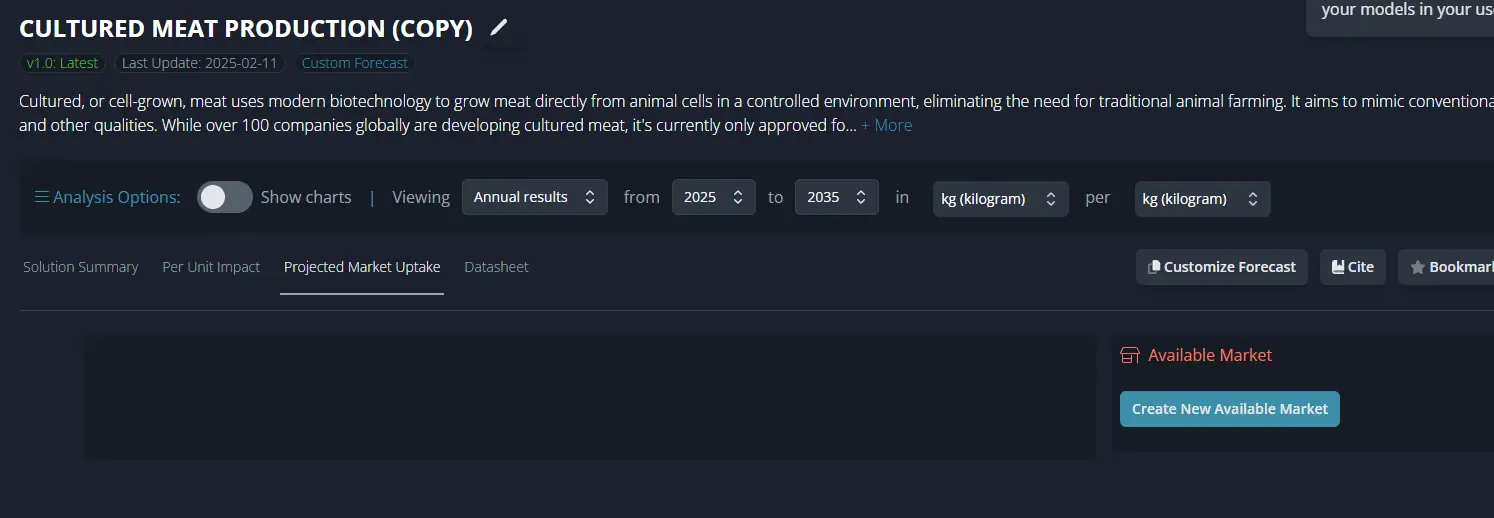
Use the *Custom Analysis* functionality to add market data from the market data in a complete model (Fermentation-Based Protein-Rich Meat Alternatives here). Select the blue button to create a new available market.
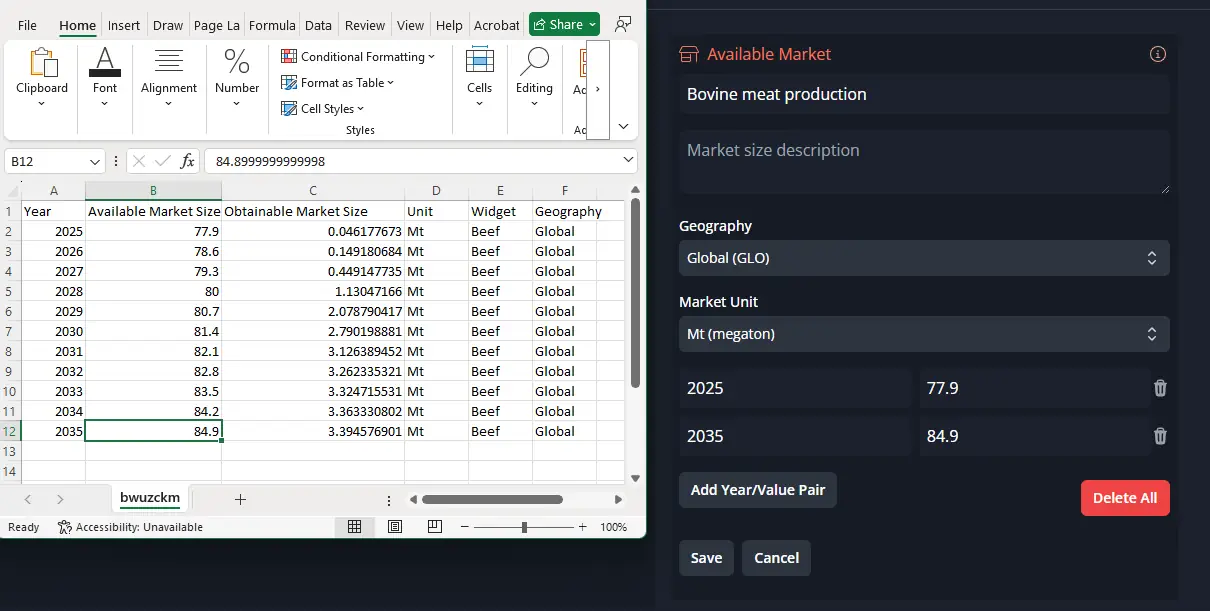
In this example, bovine meat market data is added to the *Cultured Meat Production* model from the *Fermentation-Based Protein-Rich Meat Alternatives* model.
Enter data obtained from other Koi models or anywhere else that has useful information related to the the technology of interest.